Introduction
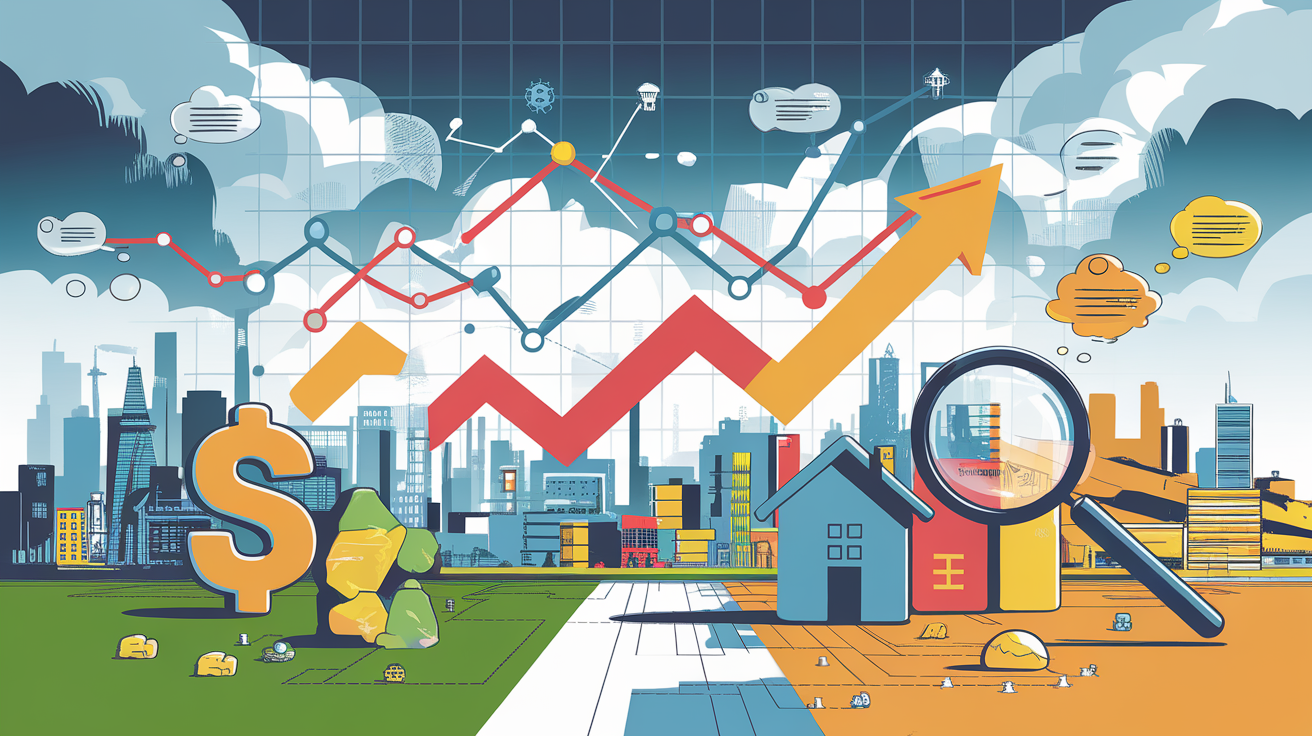
Economic indicators are the foundation of understanding market trends and evaluating the health of an economy. These metrics, including unemployment rates, GDP, and consumer price indexes, offer crucial insights into economic activity and direction. By interpreting data from reliable sources like the Bureau of Labor Statistics or the Census Bureau, businesses and policymakers can anticipate changes, address challenges, and seize opportunities effectively.
In today’s rapidly shifting economic environment, tracking leading, lagging, and coincident indicators provides a multi-dimensional view of current and future trends. Real-time data, combined with historical analysis, enhances the ability to make informed decisions. Whether monitoring inflation or leveraging insights from composite indexes, understanding these dynamics is essential for fostering economic resilience and protecting financial stability.
Key Takeaways
- Economic indicators like GDP and unemployment rates are crucial for assessing market trends and economic health.
- Leading, lagging, and coincident indicators provide unique insights into future, current, and past economic conditions.
- Real-time data from sources like the Bureau of Labor Statistics enhances timely decision-making.
- Composite indexes combine multiple metrics to offer a comprehensive view of economic performance.
- Understanding inflation and interest rates is essential for managing financial stability and growth.
- Historical data analysis reveals patterns that help forecast future economic trends effectively.
The Role of Economic Indicators in Understanding Market Trends
Economic indicators serve as vital tools for interpreting the health and direction of the economy. Metrics such as unemployment rates, GDP, and the consumer price index provide insights into market performance and societal trends. By analyzing these indicators, businesses and policymakers can gauge economic activity, predict shifts, and make informed decisions. For instance, new orders and retail sales statistics can signal consumer confidence, while composite indexes combine multiple data points for a comprehensive view. Understanding these indicators helps anticipate market movements, empowering both individuals and organizations to navigate economic cycles effectively.
Understanding the Basics of Economic Indicators
Economic indicators like GDP, unemployment rates, and retail sales provide a snapshot of economic performance. These metrics offer vital clues about market trends and help businesses predict consumer behavior. By interpreting data such as new orders or stock performance, stakeholders can identify economic strengths and weaknesses. This foundational knowledge is essential for assessing both current conditions and future opportunities in the market.
Composite Indexes as a Comprehensive Analytical Tool
Composite indexes, such as the Leading Economic Index, aggregate multiple data points into a single metric to provide a holistic view of economic trends. These indexes include a mix of leading, lagging, and coincident indicators, offering a balanced perspective. By leveraging composite indexes, analysts can draw more reliable conclusions, particularly in assessing broad economic health or preparing for potential downturns.
Practical Applications of Economic Indicators in Decision-Making
1. Identifying Market Opportunities
Economic indicators, such as retail sales and consumer confidence indexes, help businesses identify areas with growing demand. By analyzing these trends, companies can target profitable markets effectively.
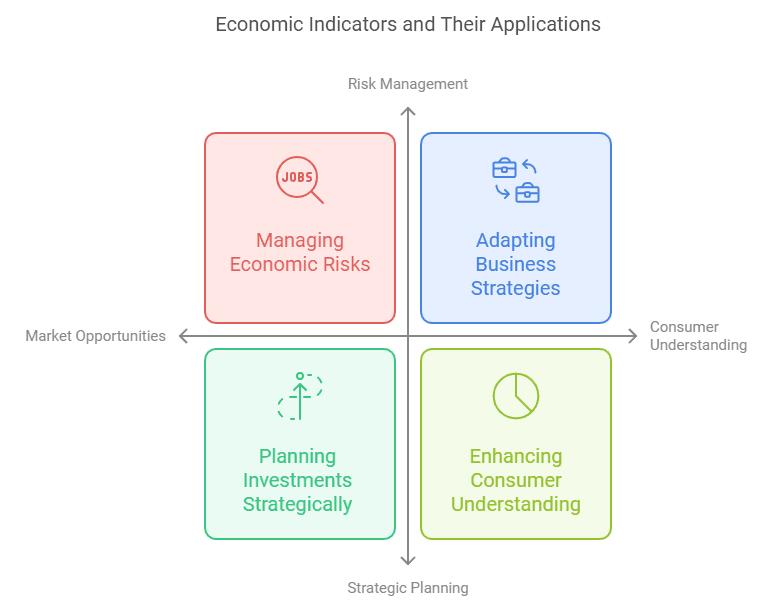
2. Planning Investments Strategically
Leading indicators like stock prices and building permits guide investors toward sectors with potential growth. These insights help in making informed investment decisions and minimizing risks.
3. Managing Economic Risks
Lagging indicators, such as unemployment rates, provide context for current economic challenges, allowing policymakers and businesses to implement timely mitigation strategies.
4. Adapting Business Strategies
Coincident indicators, including employment levels, reflect real-time economic conditions. Businesses can use this data to adjust production, marketing, or expansion plans to align with prevailing economic realities.
5. Assessing Policy Effectiveness
Inflation rates and interest rates indicate the success of monetary policies. Policymakers can refine their strategies based on these metrics to ensure economic stability.
6. Enhancing Consumer Understanding
Consumers can use data like the Consumer Price Index to make smarter decisions about spending, saving, and investing, improving their financial well-being.
Leading, Lagging, and Coincident Indicators: Key Differences and Uses
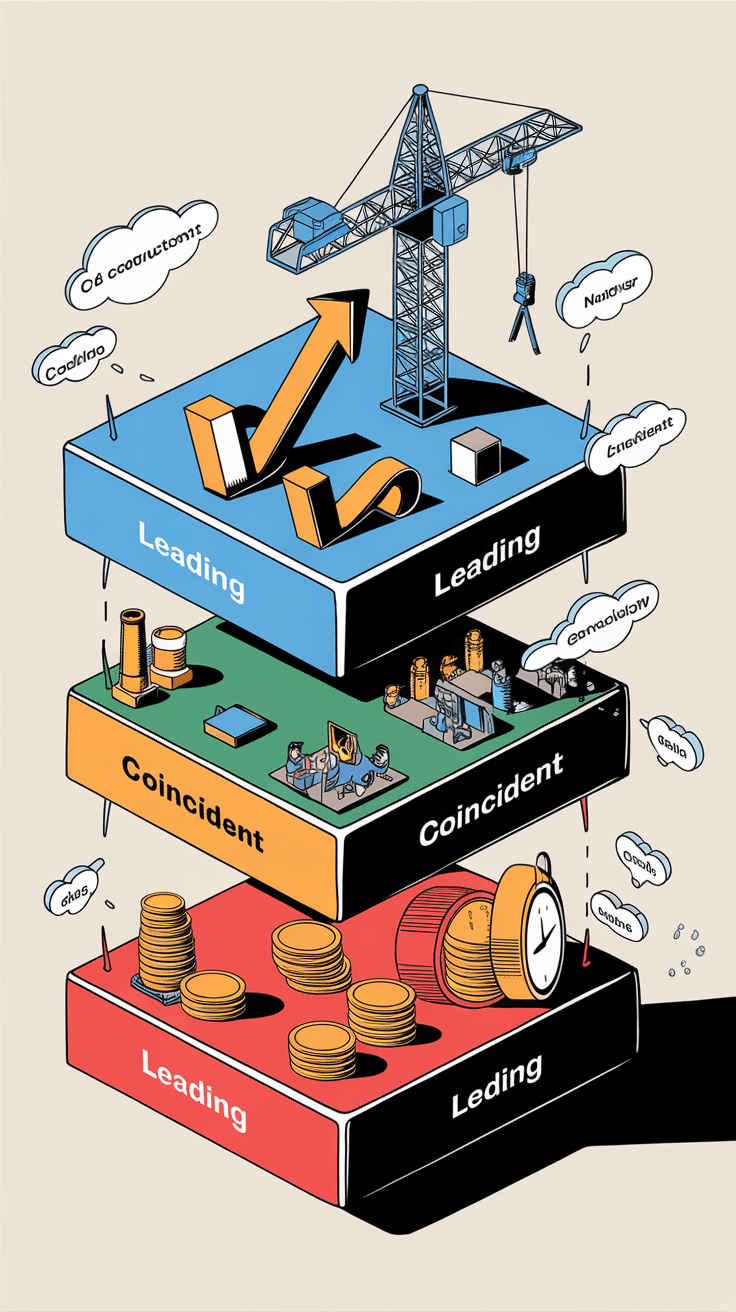
Economic indicators fall into three primary categories: leading, lagging, and coincident. Leading indicators, such as building permits and stock prices, forecast future economic conditions. Coincident indicators, like employment levels, align closely with the current state of the economy. Lagging indicators, including unemployment rates, provide insights after economic trends have occurred. Together, these categories form a cohesive framework for analyzing economic health. By leveraging this structure, analysts can pinpoint economic turning points and develop strategies to mitigate risks or capitalize on opportunities in both short- and long-term scenarios.
Leading Indicators and Their Predictive Power
Leading indicators, such as building permits and stock prices, help forecast economic changes before they occur. For example, an increase in building permits often signals future growth in the housing market. These metrics enable proactive planning, making them indispensable for businesses and policymakers preparing for upcoming shifts in economic conditions.
Coincident and Lagging Indicators for Assessing Economic Health
Coincident indicators reflect the current state of the economy, while lagging indicators provide retrospective insights. Employment levels and industrial production are examples of coincident indicators, directly tied to economic activity. In contrast, lagging metrics like unemployment rates offer validation of trends after they unfold. Together, these indicators provide a comprehensive picture of economic performance.
Case Study: Using Economic Indicators to Predict a Recession
In 2007, economists and analysts closely monitored leading indicators such as the yield curve, building permits, and stock market performance to predict the upcoming economic downturn. The inversion of the yield curve, a reliable predictor of recessions, signaled a significant risk. Simultaneously, lagging indicators like unemployment rates started to show gradual increases, reinforcing the concerns.
During this period, businesses that heeded these warning signs were better prepared. For instance, companies in the housing sector adjusted their strategies by reducing investments in new projects as building permit data dropped. Policymakers also utilized this data to introduce stimulus measures aimed at stabilizing the economy.
The Impact of Inflation and Interest Rates on Economic Conditions
Inflation and interest rates significantly influence economic stability and individual financial well-being. Rising inflation can erode purchasing power, while fluctuating interest rates affect borrowing and investment behaviors. The Federal Reserve uses these metrics to regulate economic activity and maintain balance. For instance, the consumer price index and gross domestic product are closely monitored to ensure economic growth without overheating. Understanding how these elements interact is essential for businesses, investors, and consumers aiming to navigate an ever-evolving economic landscape.
How Inflation Shapes Consumer Behavior and Investment
Inflation directly impacts purchasing power, making it a critical economic indicator for consumers and investors alike. Rising prices can deter spending while encouraging investment in assets like real estate. Monitoring inflation through tools like the Consumer Price Index allows individuals and organizations to adjust their financial strategies accordingly.
The Role of Interest Rates in Economic Stability
Interest rates influence borrowing costs, saving rates, and overall economic activity. Adjustments by the Federal Reserve often aim to balance inflation and growth. Understanding these changes helps stakeholders, from homeowners to investors, make informed decisions about loans, mortgages, and investments that align with their financial goals.
“Economic indicators are the pulse of a nation’s economy. By understanding their signals, we can foresee challenges and act to protect our financial future.” — Jerome Powell, Chair of the Federal Reserve (Source: Federal Reserve Board Speeches)
Harnessing Real-Time Data and Historical Trends for Economic Insights
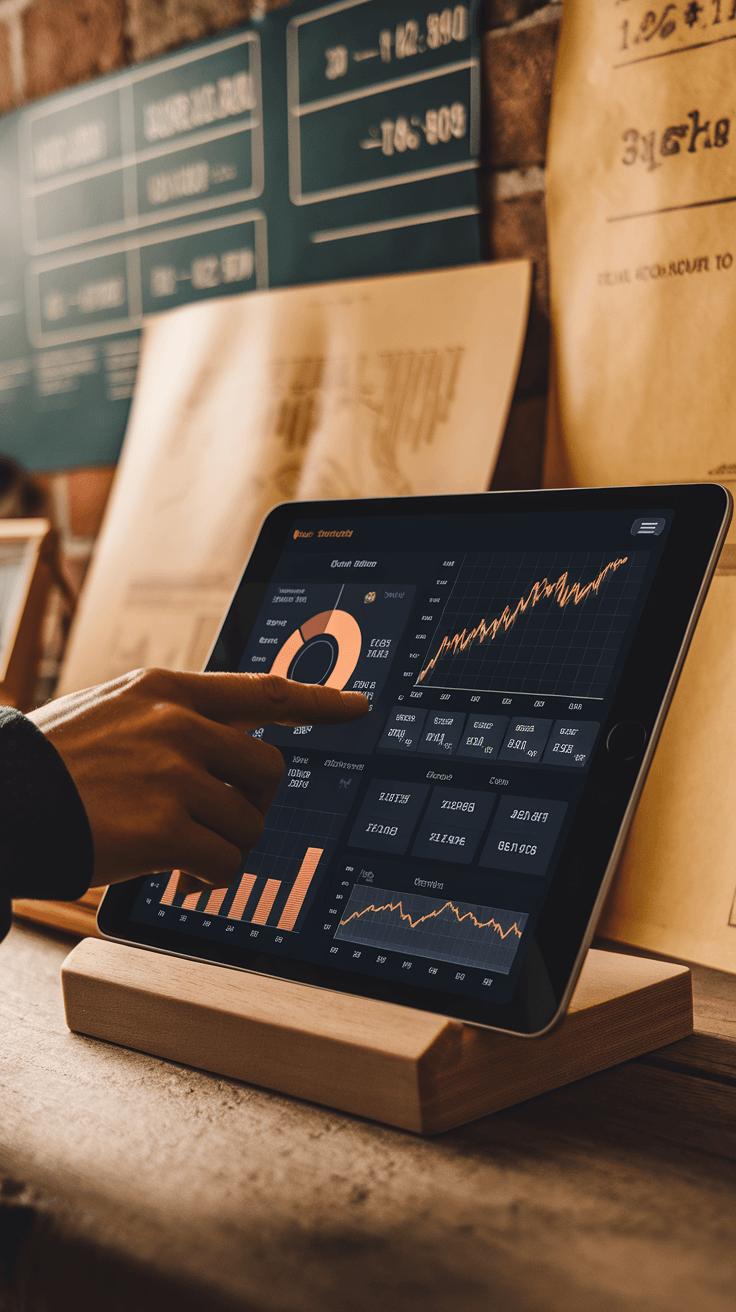
Access to real-time economic data and historical trends offers unparalleled advantages for forecasting and decision-making. Platforms like the Bureau of Labor Statistics and Census Bureau portals provide timely updates on indicators such as employment rates and industrial production. Examining historical data uncovers patterns, such as peaks and troughs in business cycles, which inform future predictions. By combining real-time insights with historical analysis, stakeholders can adapt strategies to dynamic market conditions, ensuring informed decisions that safeguard economic stability.
Utilizing Real-Time Data for Economic Monitoring
Real-time data from platforms like the Bureau of Labor Statistics or Census Bureau enables immediate analysis of economic indicators such as employment rates and industrial production. These updates empower businesses to adapt to shifting market conditions, ensuring timely responses to emerging trends.
Learning from Historical Economic Trends
Analyzing historical data provides valuable insights into economic cycles, such as peaks and troughs. For example, patterns in housing starts or retail sales can indicate broader market movements. By comparing past and present data, businesses and policymakers can develop strategies that are resilient to economic fluctuations.
Conclusion
Economic indicators serve as essential tools for evaluating and maintaining economic health. From tracking unemployment rates to analyzing GDP and inflation, these metrics provide a roadmap for navigating complex economic landscapes. Leading, lagging, and coincident indicators, when understood and applied effectively, enable businesses, policymakers, and individuals to anticipate changes and make informed decisions.
Incorporating real-time data with historical insights strengthens economic strategies and builds resilience against potential downturns. By leveraging resources like the Bureau of Labor Statistics and composite indexes, stakeholders can align their goals with evolving market conditions. Understanding these dynamics is not only critical for immediate responses but also for safeguarding long-term economic stability.


