Introduction
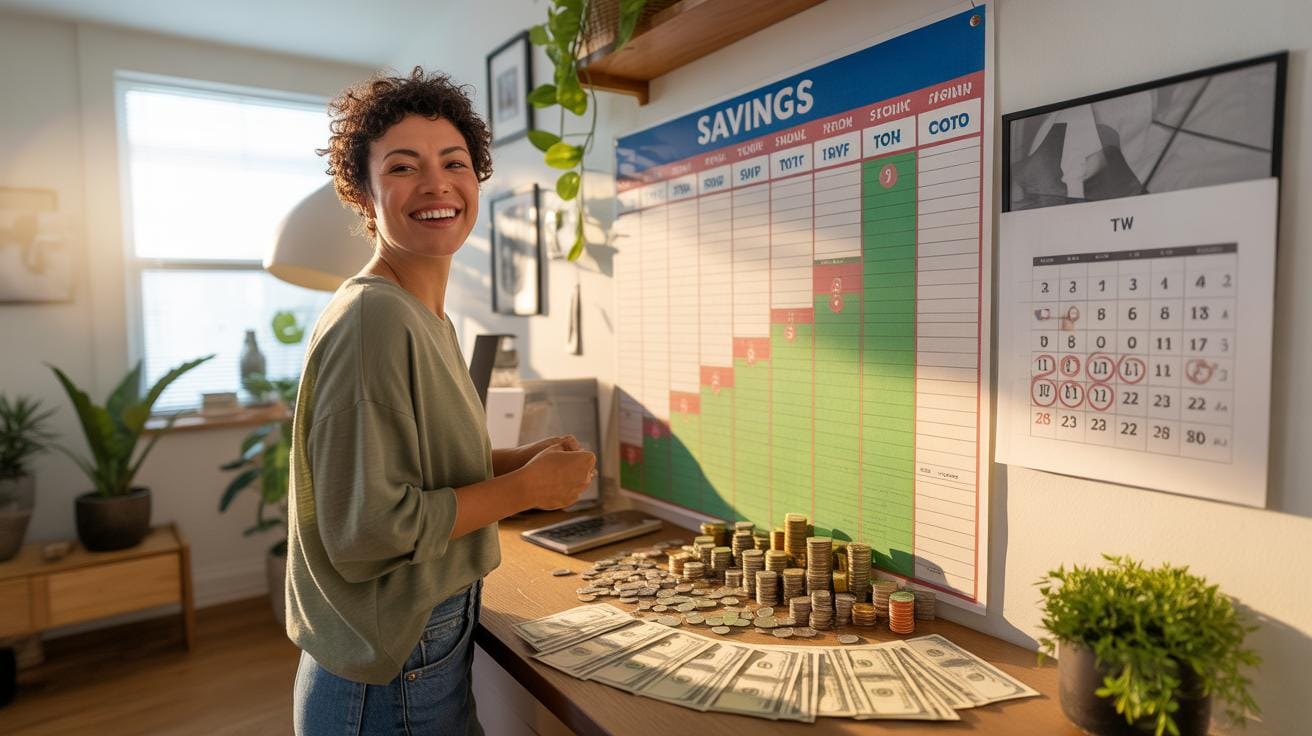
Saving money can be challenging, but using a money chart can make it simpler. A money chart is a visual tool that helps you see your progress day by day. This article will show you how to save 1000 dollars in a year by tracking your savings daily with a money chart.
We will cover how to set up your chart, why tracking is important, different methods to use, and ways to keep motivated. By the end, you’ll have a clear plan and tools to reach your savings goal.
Set Up Your Money Chart

To create a money chart for daily savings tracking, you don’t need much—just some basic materials and a simple layout. Grab a sturdy notebook, a large poster board, or even a plain sheet of graph paper. You want something visible and easy to update, so perhaps select a spot where you’ll see it every day. Pens, markers, or colored stickers help make the chart more engaging and easier to interpret at a glance.
The layout can be straightforward: list the days of the year in rows or columns, with a space next to each day to note your savings amount. Some people like to total weekly or monthly savings to see smaller milestones along the way. The key is to keep it neat but flexible—you want to want to use it daily!
Creating An Effective Daily Tracker
Start by numbering the days—1 through 365 or 366 if it’s a leap year. Beside each number, mark how much you plan to save or actually saved. You can use simple checkmarks, dollar amounts, or color codes to show progress, missed days, or bonus savings. Calculating your accumulated total every week helps maintain motivation; it’s easier to see growth when numbers stack up.

For example, if you save $3 daily, after 10 days, you’d write $30. It sounds trivial when it’s just a day, but these small increments add up fast. Adjust your chart if you find some days tougher to save—maybe less on a weekend but more on a weekday. This adaptability can help keep the tracker realistic and less discouraging.
Tools For Tracking Your Progress
There are plenty of options to keep tabs on your savings. Consider apps like Money Manager or Mint, which automate tracking and send reminders but require some initial setup. Spreadsheets (Google Sheets, Excel) allow custom charts and formulas but need a bit of tinkering. Physical charts, on the other hand, might lack digital bells but tend to remind you constantly simply by being there.
Each tool has upsides and downsides. Apps offer convenience but sometimes tempt you to skip manual effort. Spreadsheets are flexible but demand some skill and time. Physical charts lack automation yet offer a tactile, satisfying experience. You might even combine methods—for instance, a physical chart for daily check-ins and an app for monthly summaries. What feels most natural to you? That’s where you’ll find the most success.
Why Daily Tracking Matters

Tracking your savings on a daily basis offers a few benefits that weekly or monthly check-ins might miss. When you jot down your progress every single day, it’s easier to catch small patterns—both good and bad—that add up over time. For example, you might notice certain days when you’re more tempted to spend or when you find it easier to save. This kind of immediate feedback can be surprisingly motivating. It’s not just about seeing numbers; it’s about feeling a sense of accomplishment or realizing you need to adjust quickly.

Daily tracking also builds a kind of routine, turning saving money into a habit rather than a chore. When it becomes part of your day, you’re less likely to forget or skip it. It’s interesting how just a little routine can gently nudge your brain into making better choices—often without you even noticing it. Over time, that small action can grow into a consistent, positive behavior that feels natural.
Plus, keeping your savings visible every day raises awareness about your spending habits. When you see your savings amount regularly, it’s hard to ignore the impact of an impulse purchase or a coffee splurge. Awareness can act as a subtle brake, making you think twice before spending unnecessarily. This constant visibility might even help prevent those moments of buyer’s remorse, which nobody likes to deal with later on.
Calculate Your Daily Savings Goal

Breaking down a $1000 savings target into daily chunks might make it seem less daunting, don’t you think? Instead of staring at a big lump sum, try thinking about how much you need to set aside each day, then carry that forward into weekly and monthly goals. For example, dividing $1000 by 365 days gives roughly $2.74 a day. Doesn’t sound too bad, right? Weekly, that’s about $19.18, and monthly, around $83.33.
Let’s look a bit closer. You could round that daily amount to $3, making it easier to remember and track. That small extra bit could earn interest over time, or you might have cushion for days when saving feels tricky. The math doesn’t have to be perfect; it’s more about setting something practical you can stick with.

Now, what if your income changes? Life is unpredictable, after all. If you get a bonus or your paycheck fluctuates, adjust those daily amounts up or down accordingly. Some months you might save a bit more, others a bit less. The key is keeping an eye on your progress and recalculating when needed. It’s flexible, not rigid. The goal is making saving fit your life, not the other way around.
Compare Money Chart Types
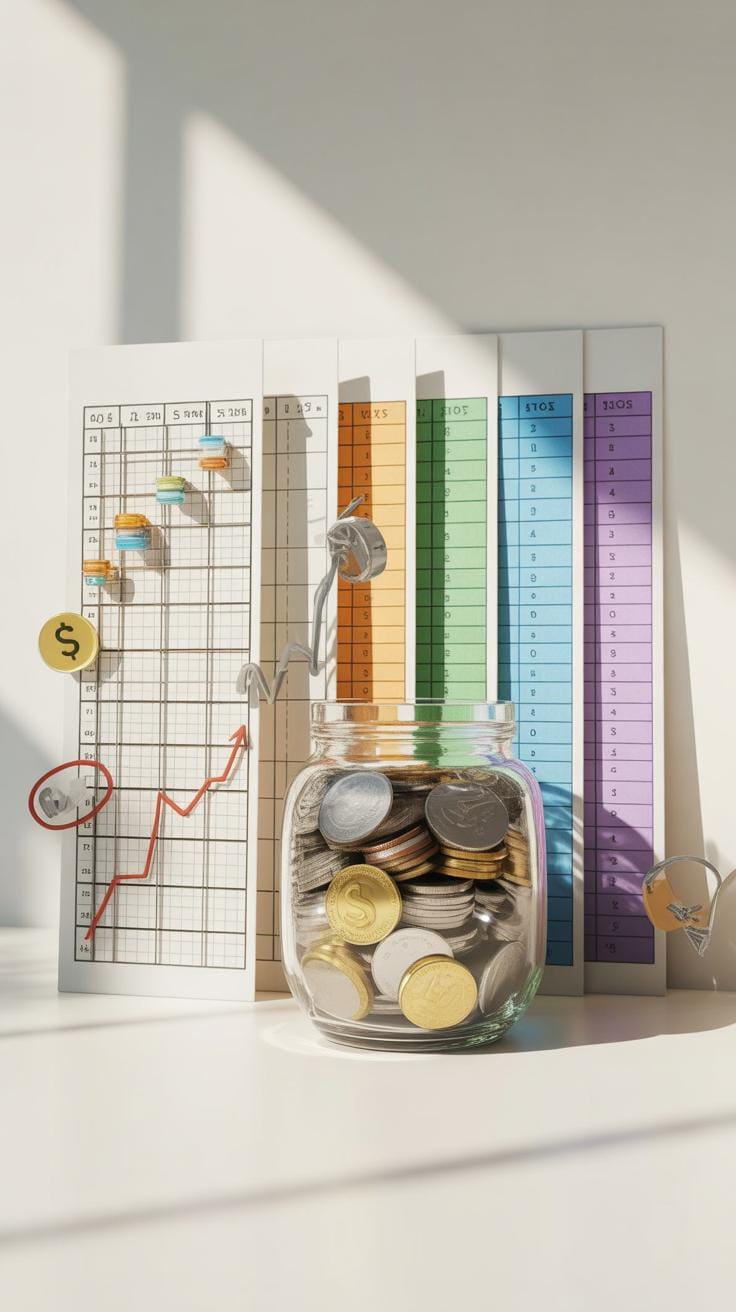
When it comes to tracking your savings, the type of money chart you use can make a real difference. There isn’t one “best” style—it really depends on what works for you. Let’s take a look at three common types: grid charts, jar charts, and color-coded charts.
Grid charts usually have a simple layout of squares or boxes representing dollars or smaller units. You fill in each box as you save. It’s straightforward and offers a clear visual progress meter, which can be motivating if you like to see exact numbers. But sometimes, that rigidity might feel a bit dull or overwhelming if you prefer a more hands-on approach.
Jar charts, on the other hand, involve physically putting money into jars or containers labeled by savings goals. This tactile method can feel more real—actually holding your savings seems to make it tangible. However, it can be less precise in tracking smaller increments and might be tricky if you want detailed records.

Color-coded charts blend visuals with simplicity. They usually use colors to represent different amounts saved, making it easy to glance and know where you stand without focusing on numbers. This appeals to those who are more visual learners but could be vague for people who need exact details.
Overall, grid charts give precision, jar charts add a physical connection, and color-coded charts offer easy visual cues. Trying out a couple might help you find what clicks for your motivation and style.
Grid Charts Versus Jar Charts
Grid charts and jar charts also differ quite a bit in how they look and feel during daily use. The grid chart is neat, orderly, and can sometimes even feel like a checklist, pushing you to fill it up. But it can be a bit tedious or uninspiring after a while, especially if it’s just rows of tiny boxes.
Jar charts, meanwhile, are more interactive. Watching the jar fill up with actual cash can excite those who respond better to hands-on progress, yet some might find managing jars inconvenient if space or privacy is a concern. Plus, the jar’s visuals are less detailed—the money sits there, but you might not see the exact progress in smaller steps.
So, you get a tidy, data-focused grid or a casual, tangible jar experience. Neither is right or wrong, but each fits different moods and habits.
Choosing What Fits Your Style
Choosing the right money chart isn’t just about what helps you save—it’s also about what you’ll stick with. If you’re someone who loves numbers and feels motivated by ticking off exact amounts, a grid chart might suit you best. Someone who enjoys a physical reminder and a more relaxed routine could do better with jar charts.

If you prefer simplicity without losing track, color-coded charts might be your thing. Think about your daily life: Do you want to carry jars around, or do you prefer something on paper or your phone? Are you more motivated by seeing numbers ticking up or by color shifts you can glance at easily?
Ultimately, your money chart should be a tool that fits your personality, not a chore you dread. It’s okay to switch or mix styles as you go—saving is personal, so find your own rhythm.
Track Expenses Alongside Savings

Tracking expenses daily is a practice that shines a light on where your money actually goes. It’s easier to save when you know the details of your spending habits, not just your income and savings. For example, jotting down a coffee purchase or that small snack might seem trivial, but over time these small amounts add up. Seeing them logged daily can reveal patterns you might not notice otherwise.
Simple routines can make it less of a chore to note your spending every day. You don’t need complex apps or lengthy journals. A quick note on your phone, a sticky note in your wallet, or a quick entry on a piece of paper works just fine. The key is to be consistent without letting it overwhelm you.

With this insight, you can start to cut back on small, unnecessary spends—maybe skipping a daily latte or bringing lunch from home instead of buying out. The savings from little adjustments like these can be added directly to your daily savings goal, making your money chart a more powerful tool. It’s surprising how small changes add up fast when you keep track.
Stay Motivated With Milestones

Saving money isn’t just about putting cash away; it’s about staying engaged with your progress. Setting milestones helps you celebrate small victories instead of waiting for the distant big goal. Maybe after saving your first $100, mark it clearly on your money chart. It feels good to see the numbers moving up, and you’ll likely want to keep that streak going. Milestones make the process less abstract—you know exactly what you’ve achieved and how far you have to go.
Marking Weekly And Monthly Wins
Splitting your savings target into weekly or monthly mini-goals creates a rhythm. You might aim to add $25 each week or $100 monthly. When you hit these marks, acknowledge it: maybe treat yourself to a simple pleasure like a favorite coffee or a break from budgeting for a day. These rewards aren’t about splurging; they’re about reinforcing your commitment. Seeing those wins graphically on your chart keeps it real and satisfying.
Sharing Success For Accountability
Sometimes, telling a friend or family member about your saving goals and progress encourages you to stick with it. They can cheer you on or remind you when motivation dips. Sharing your achievements turns your private plan into a shared journey. But be mindful: choose people who support you genuinely without pressuring you. Otherwise, it might backfire and feel like added stress instead of support.
Deal With Setbacks Quickly


Missing a savings target on a particular day or week doesn’t mean the entire plan is sunk. It’s easy to feel discouraged, but the key is to tackle the issue straight on, without fussing too much. I remember once missing a week because of unexpected expenses; I didn’t panic. Instead, I paused and asked myself what exactly went wrong.
Analyzing What Went Wrong
Start by digging into your money chart and daily spending notes. Ask: Did a surprise bill pop up? Or maybe impulse purchases crept in unnoticed? Look for patterns rather than blaming a single moment. You might find little leaks—like daily coffee runs adding up or forgotten subscriptions. This step is less about guilt and more about clarity.
Fast Recovery Plans
Once you’ve pinpointed where the setback occurred, draft a plan that balances making up for lost savings without feeling like a strain. For example, try cutting back on non-essentials for a few days, or setting aside a slightly higher amount for one week only. Sometimes, spreading the catch-up over a few weeks works better, especially if funds are tight. The goal is to regain momentum while still being realistic with what you can manage.
Use Technology To Help Savings


Tracking your money chart can feel tedious, right? But technology actually makes this part easier. There are apps that link directly to your bank accounts and update your savings progress automatically. You don’t have to log every single penny manually — the app does it for you. This can be a relief when you’re busy or just not in the mood to crunch numbers.
A few popular apps worth trying are Mint, YNAB (You Need A Budget), and PocketGuard. They show you charts, daily or weekly progress, and overall trends that encourage you to keep going. Seeing graphs that update in real time can be surprisingly motivating. It’s almost like the chart comes alive, nudging you forward.
Another useful feature is notifications. Setting reminders for daily savings deposits or budget reviews can make a difference. They work like small nudges. You know, those tiny prompts that stop you from forgetting or procrastinating. I’ve noticed when my phone pings me to review my money chart, I actually pull it up and think about my spending choices, which helps keep me consistent.
Have you ever thought about how much a simple alert can change your saving habits? It is a small thing, but it can prevent days slipping by without any action. And that adds up in the long run. Just a little beep can keep your saving streak alive.
Plan Spending To Maximize Savings

Planning your expenses ahead might sound a bit tedious, but it really pays off when it comes to stashing away money. Think of your money chart as a forecast map—where you plot out necessary expenses first, then see what’s left for extras. This way, you’re less likely to make those impulsive buys that quietly chip away at your savings goal.
Try giving yourself a clear vision of what you need to cover weekly. You could even jot down anticipated groceries, transportation, or small outings. When those expenses are pre-planned on your money chart, they feel less like sudden drains on your cash and more like manageable parts of your routine.
Budgeting Weekly Expenses
Some folks swear by the envelope method—setting aside cash for each spending category. It’s a practical twist on your money chart. When the envelope’s empty, spending stops. But if you’re more of a digital person, setting clear spending limits on your chart can keep your weekly expenses in check too.
One way to do it is to allocate amounts for each category on your chart at the start of the week. Maybe $30 for dining out, $50 for groceries. Seeing these figures daily nudges you to stay within your budget. It’s like having a subtle daily checkpoint that encourages smarter decisions.
Reviewing And Adjusting Budgets Regularly
Budgets aren’t set in stone. Life throws curveballs, one week may be tight, another looser. That’s why you want to revisit your chart regularly—weekly or biweekly. Ask yourself tough questions: Are my spending limits realistic? Did I overestimate some expenses? Could I trim some areas without feeling deprived?
Adjustments might mean shifting funds from entertainment to savings one week, or loosening up a bit after a month of strict budgeting. This flexibility is part of what makes your money chart useful. It grows with you, instead of against you.
So, keep your money chart alive. Treat it as a living document, something you shape as you learn your true spending patterns. It’s not about perfection but about moving steadily toward that $1000 saving goal, day by day.
Examples Of Saving Success

Saving $1000 within a year sounds doable, but it’s often trickier than it looks. Many people have tried—and succeeded—using money charts, which show daily or weekly savings clearly. One story I came across was about a couple who, by tracking every dollar they set aside on a simple chart pinned to their fridge, managed to reach their goal before the end of the year. The visual reminder helped them resist impulse purchases because they could see progress piling up.
Data backs this up: people who track savings daily report higher follow-through rates. This might be because the chart creates a small daily commitment, rather than a vague, distant target.
What stands out? The success doesn’t come from complexity. It’s small, consistent actions recorded simply. Could you do the same with a chart on your wall or a digital tracker on your phone?
Case Study From A Busy Family
Families often juggle so much that saving can feel like just another task added to an overflowing list. Take, for example, the Harris family. Both parents work full time, kids have after-school activities, and there’s barely enough time for dinner at home.
They used a money chart but adapted it to fit their hectic routine. Instead of daily entries, they updated it weekly during Sunday evenings. This helped them stay involved without adding pressure. Plus, they set up reminders and made it a group activity, involving even their older kids in saving small amounts.
They faced typical hurdles: forgetting to update the chart, inconsistent deposits, or unexpected expenses. But when a week slipped, the visual chart showed the gap, nudging them to catch up.
The takeaway? With limited time, a family can still save using a chart—but it needs to be flexible and part of a shared routine.
Single Person Achiever Example
Meet Anna, a single person with a modest income. She thought saving $1000 in a year was beyond reach. What she did was keep a small money chart taped next to her desk. Every morning, she wrote down her savings goal and how much she actually saved the day before.
Her biggest challenge was staying motivated, especially after days when she could only save a little or nothing at all. Yet seeing the chart slowly fill up, even with small amounts, encouraged her to keep going.
She tweaked the chart by adding stickers on days she met or exceeded her target—simple rewards that made the process less tedious. It wasn’t about rigid perfection but gradual progress.
Her story shows that even with limited income, the discipline of daily tracking and a straightforward chart can make saving $1000 feel less out of reach. Maybe the real secret is in that daily habit of checking in on your savings.
Conclusions
Using a money chart for daily tracking breaks your savings goal into manageable steps. This method helps you stay on track and see your progress clearly. You can adjust your savings easily if needed and stay motivated by watching your chart fill up.
Remember, saving money takes discipline, but with a money chart, the work becomes organized and less stressful. Start today with a simple chart and watch how small daily savings turn into 1000 dollars in a year.